Add quantile/percentile lines to an existing ggplot cumulative
distribution function, typically one created using plotCDF().
Arguments
- x
Numeric. A vector of data corresponding to the data used to create the CDF.
- p
Numeric. Value(s) between 0-1 for the quantiles. Can be
length > 1if more than one quantile is desired.- col
Color of the lines/quantiles to be added; must be the same length as
p.- lty
Character. The line type for the added quantile lines. Can be a single value if the same line type is desired for all quantiles. Can be a vector (the same length as
p) if different line types are desired for each quantile.
See also
quantile(), plotCDF(), annotate()
Examples
rdat <- withr::with_seed(101, rnorm(100))
plt <- plotCDF(rdat, main = "Random Gaussian", x.lab = "Data")
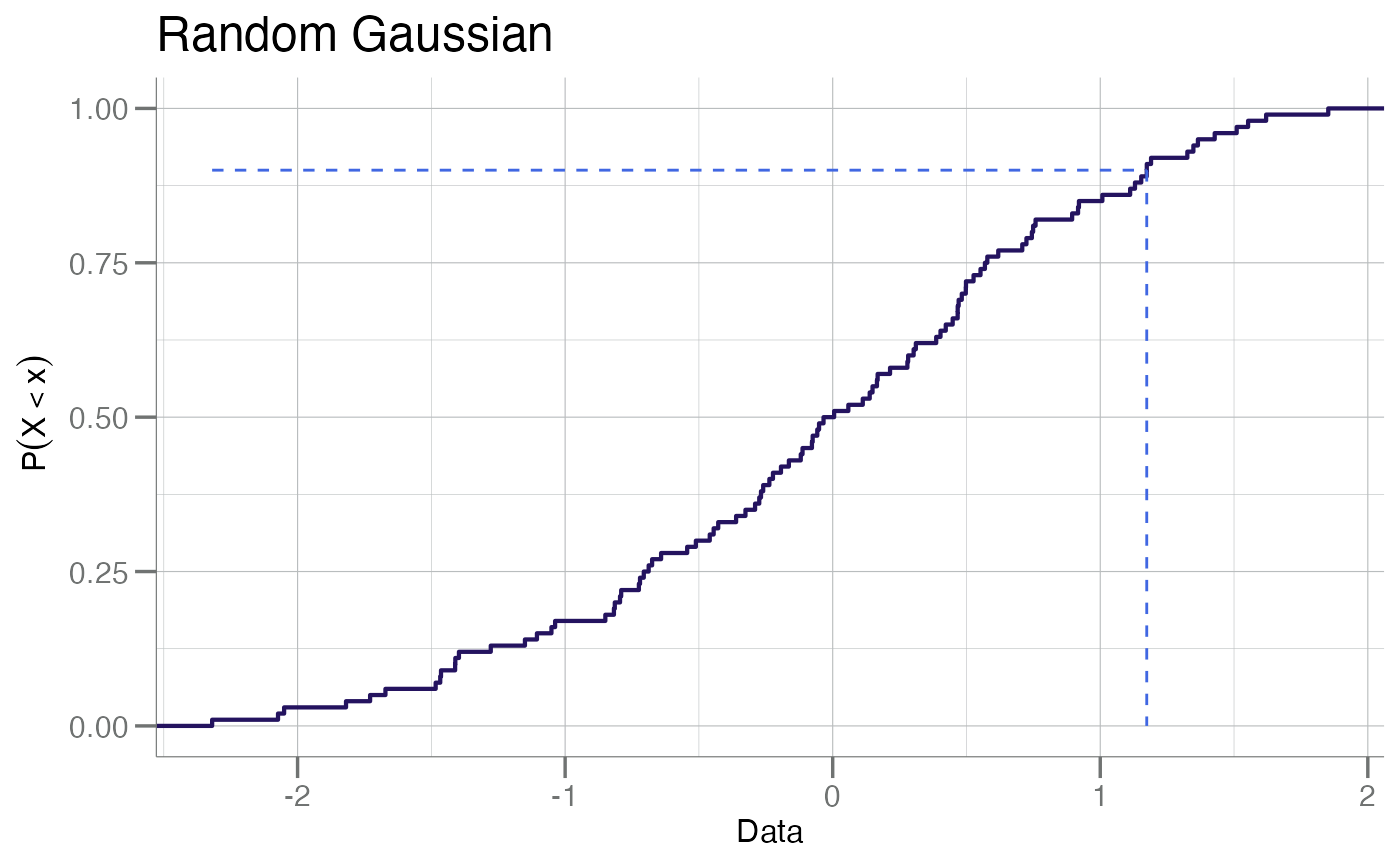
plt + addCDFquantiles(rdat, p = 0.9, col = soma_colors2$blue)
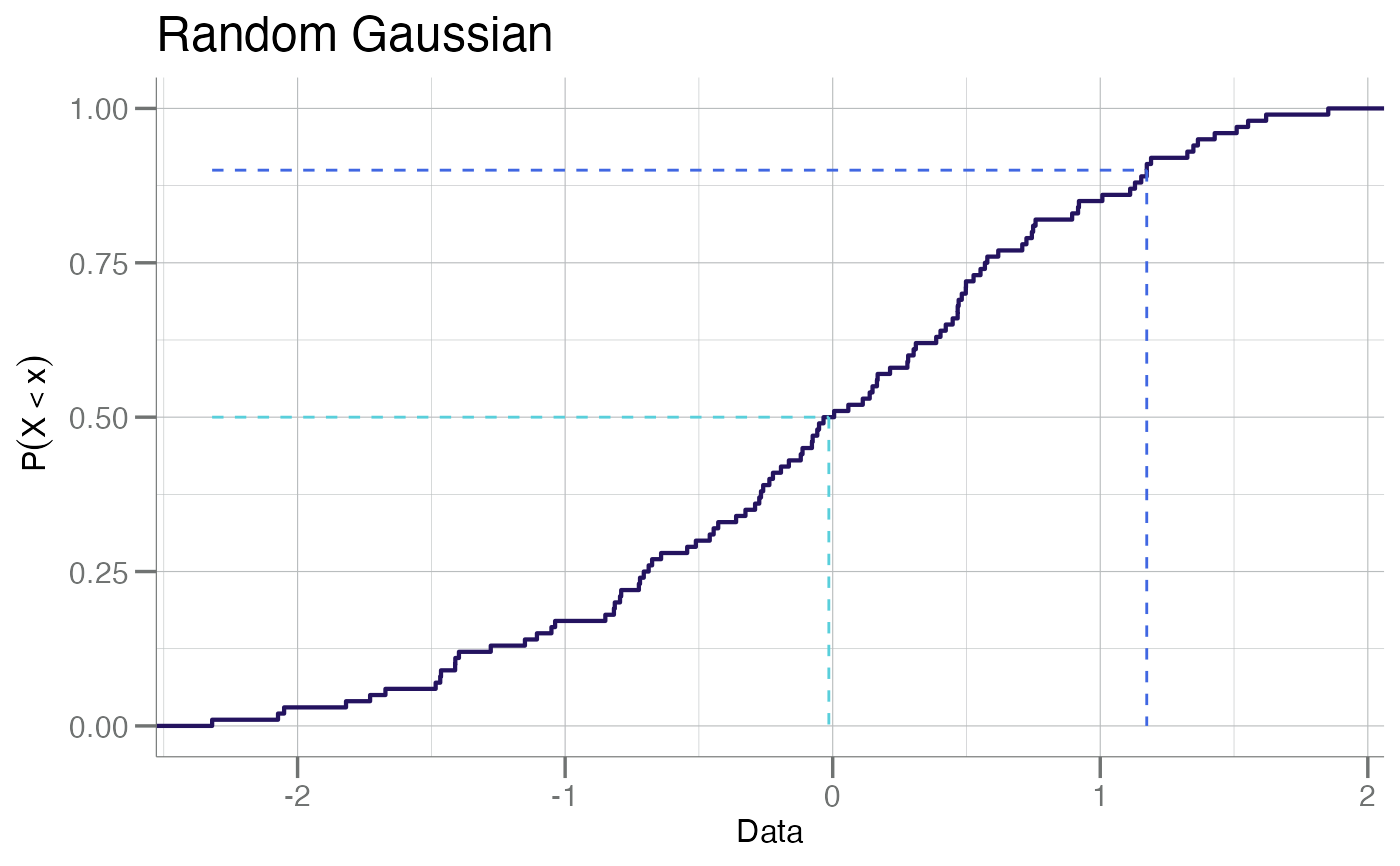
 # Multiple quantiles can be added in one call if a vector is
# provided for both 'p' and 'col' (and optionally 'lty')
plt +
addCDFquantiles(rdat,
p = c(0.9, 0.5),
col = c(soma_colors2$blue, soma_colors2$teal))
# Multiple quantiles can be added in one call if a vector is
# provided for both 'p' and 'col' (and optionally 'lty')
plt +
addCDFquantiles(rdat,
p = c(0.9, 0.5),
col = c(soma_colors2$blue, soma_colors2$teal))
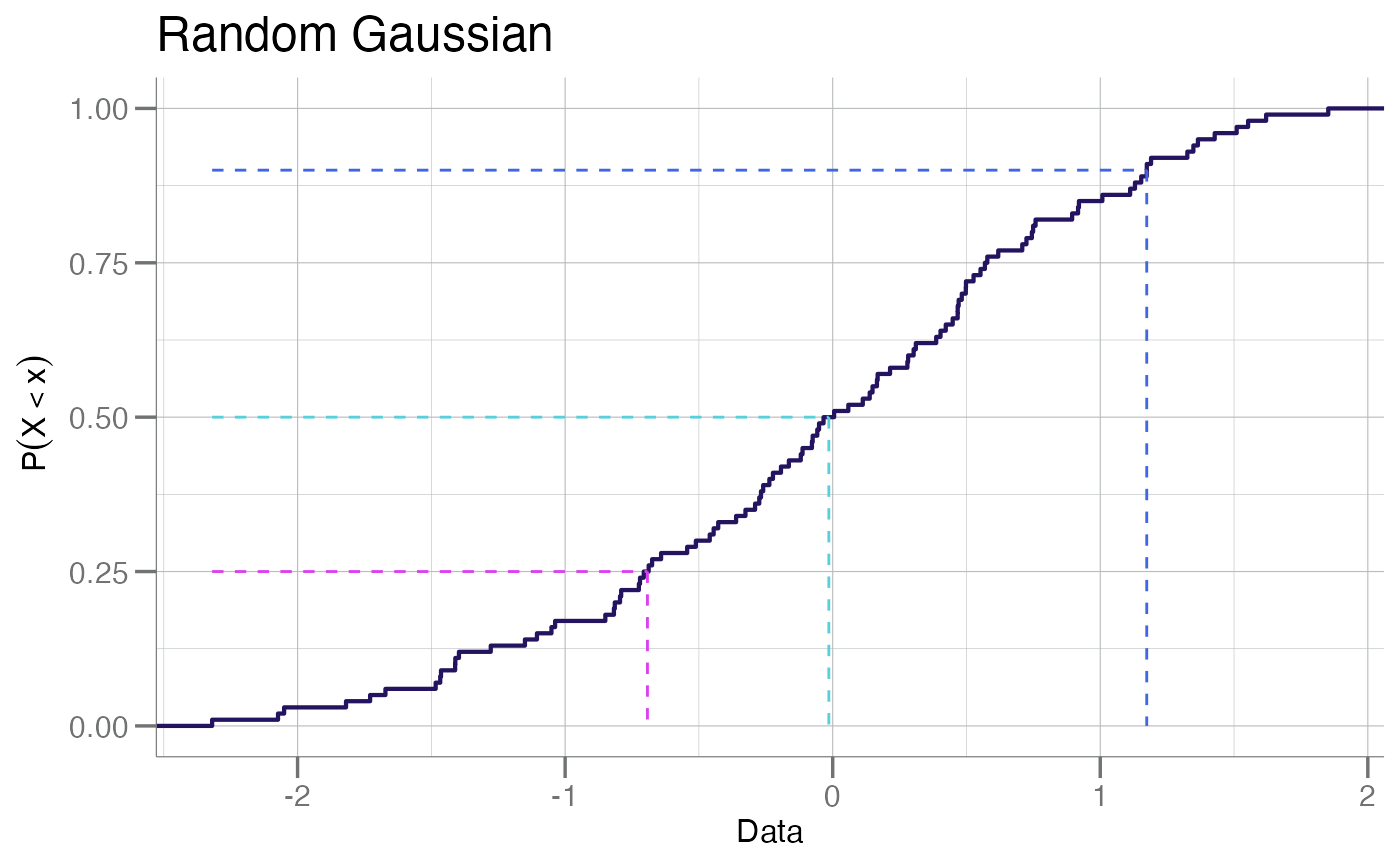
 # The same effect can be achieved by adding each quantile individually
plt + addCDFquantiles(rdat, p = 0.9, col = soma_colors2$blue) +
addCDFquantiles(rdat, p = 0.5, col = soma_colors2$teal) +
addCDFquantiles(rdat, p = 0.25, col = soma_colors2$pink)
# The same effect can be achieved by adding each quantile individually
plt + addCDFquantiles(rdat, p = 0.9, col = soma_colors2$blue) +
addCDFquantiles(rdat, p = 0.5, col = soma_colors2$teal) +
addCDFquantiles(rdat, p = 0.25, col = soma_colors2$pink)