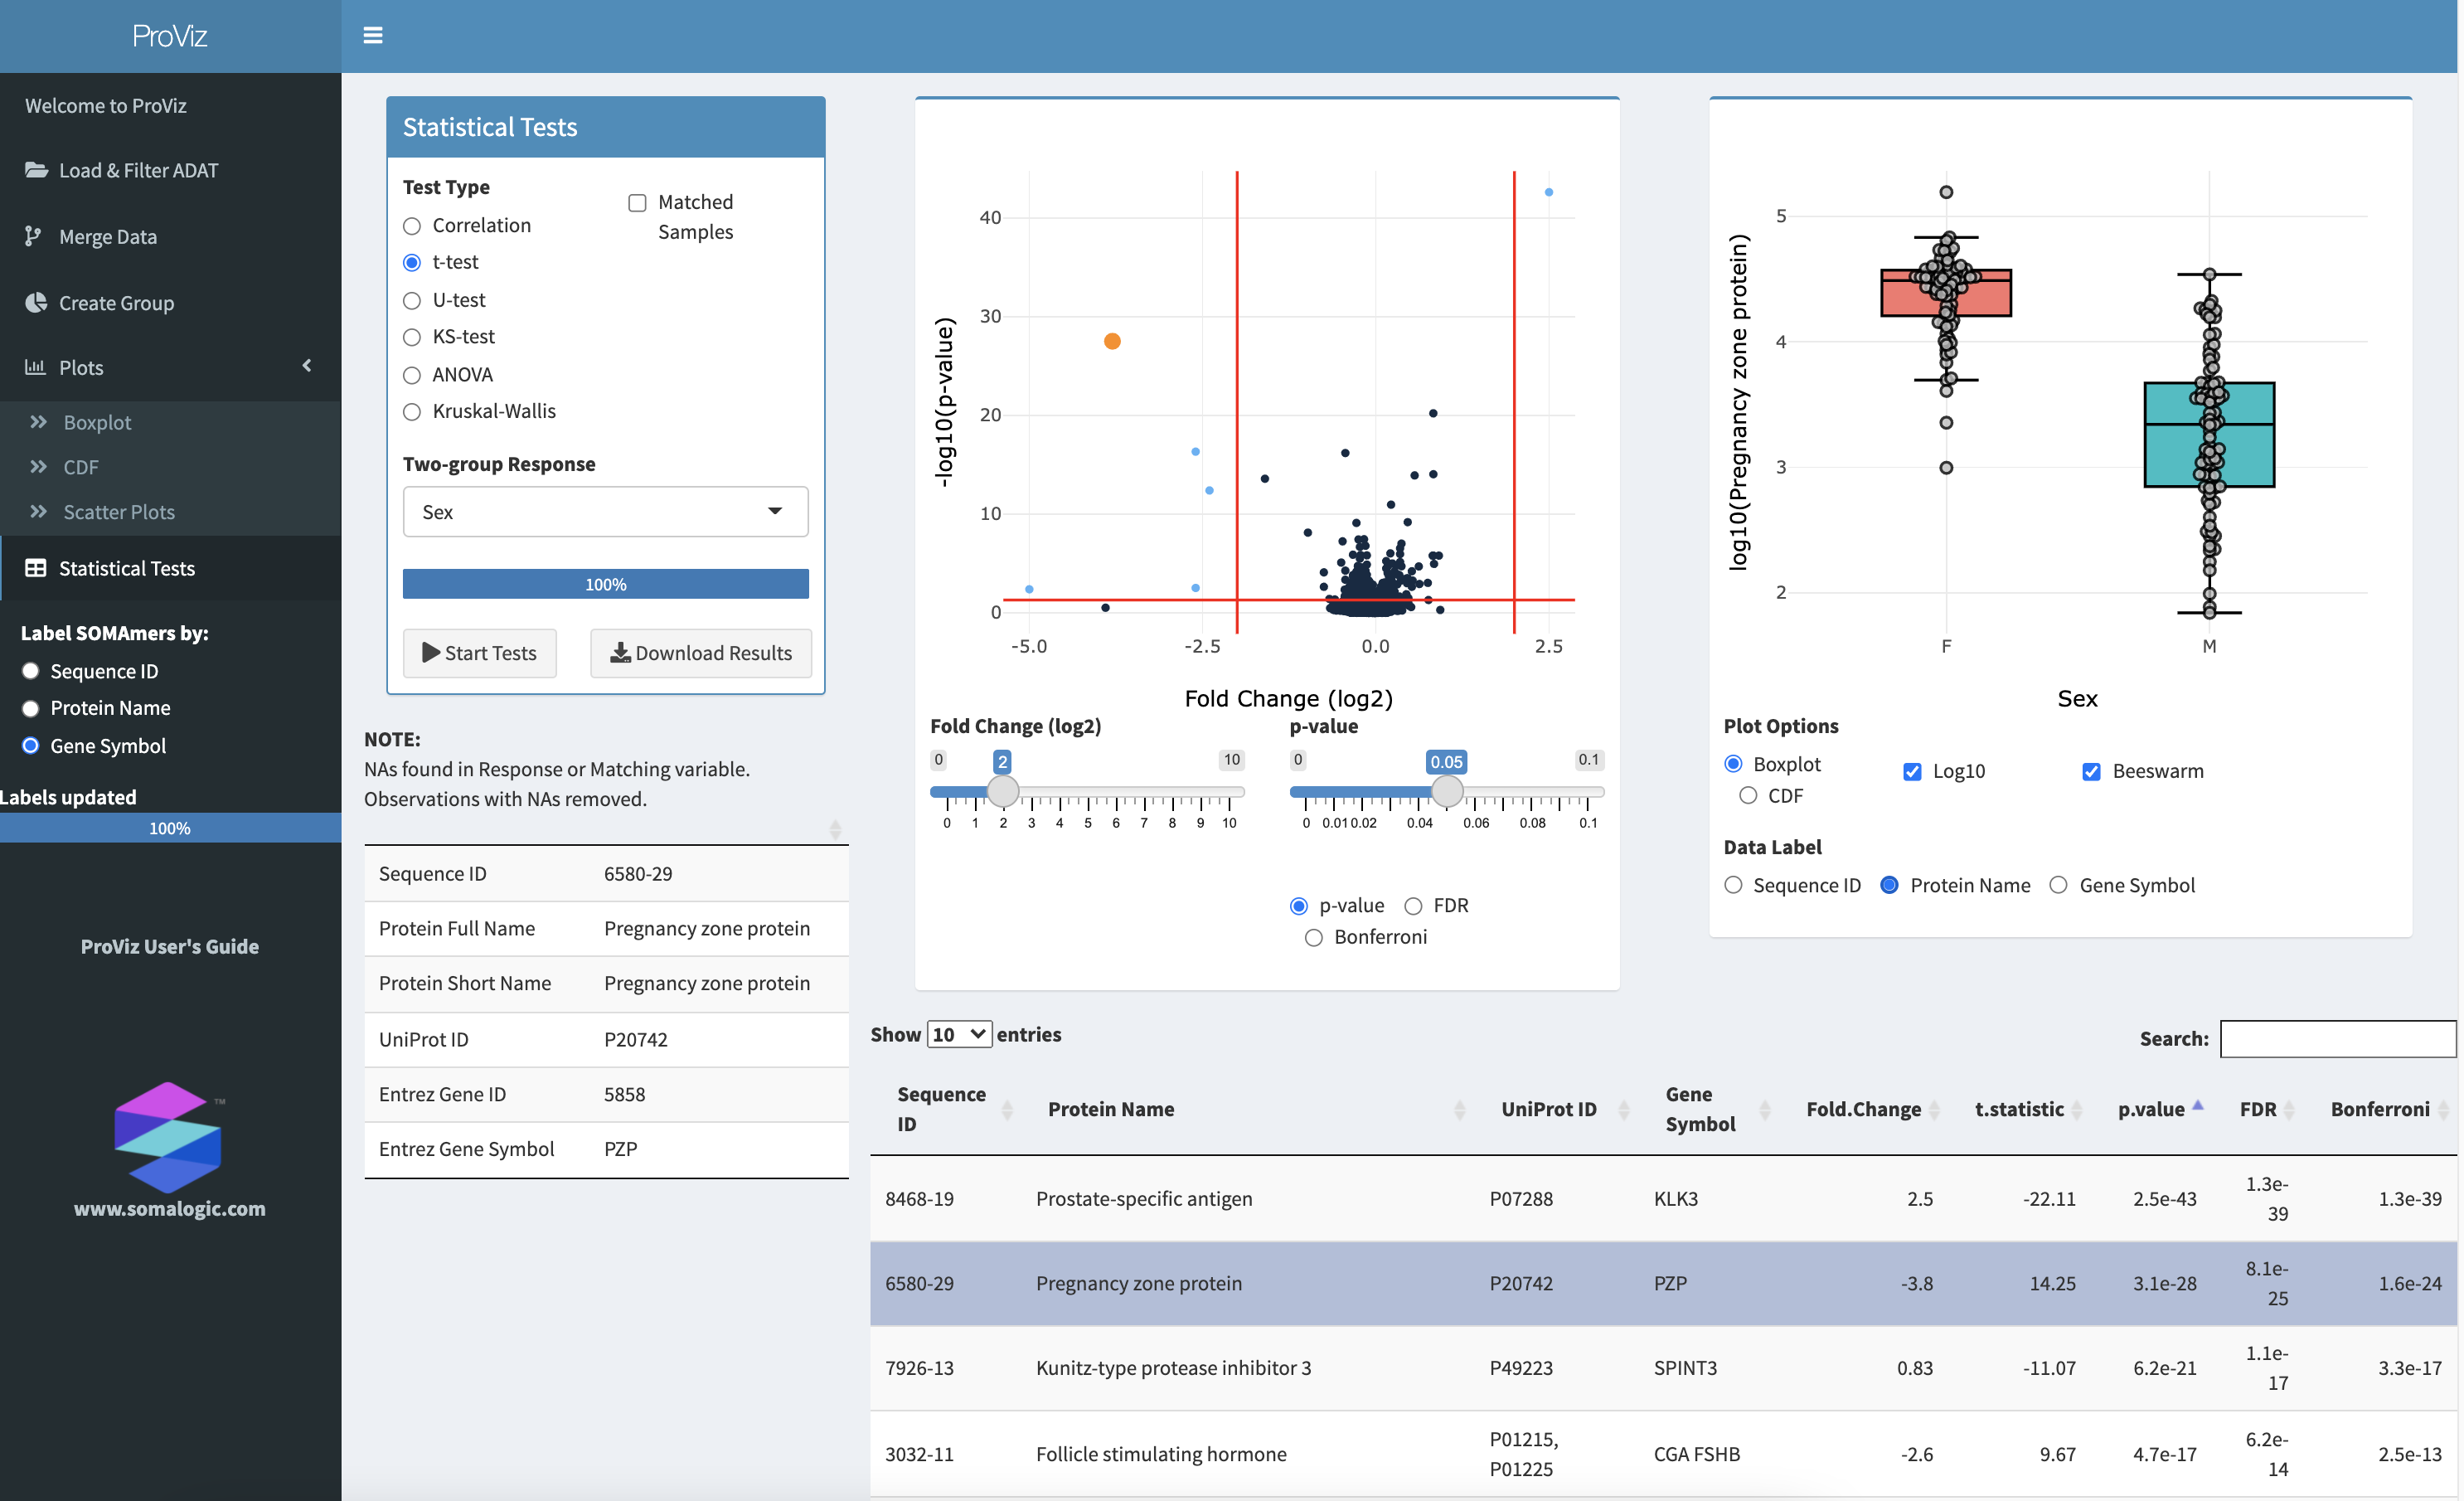
Chapter 6 Statistical Tests
The Statistical Tests panel.
6.1 Statistical Tests
Different statistical tests for comparing continuous, two-group data, or multi-group data can be performed on the Statistical Tests panel. The tests available are:
correlation - compares two continuous variables using either Pearson’s or Spearman’s rank-based methods
t-test - compares the means of two groups; a paired t-test is also available is also available by checking Matched Samples and providing a properly constructed Matching Variable
U-test - compares the medians of two groups; this is a non-parametric alternative to the t-test; a paired U-test is also available
KS-test - compares the distributions of data between two groups
ANOVA - Analysis of Variance test of the means of multiple groups; repeated measures ANOVA is also available by checking Matched Samples and providing a properly constructed Matching Variable
Kruskal-Wallis - compares the medians of multiple groups; this is a non-parametric alternative to ANOVA
Friedman’s Test - a non-parametric alternative to repeated measures ANOVA; this test is available instead of Kruskal-Walllis when Matched Samples is checked
6.2 Selecting a Response
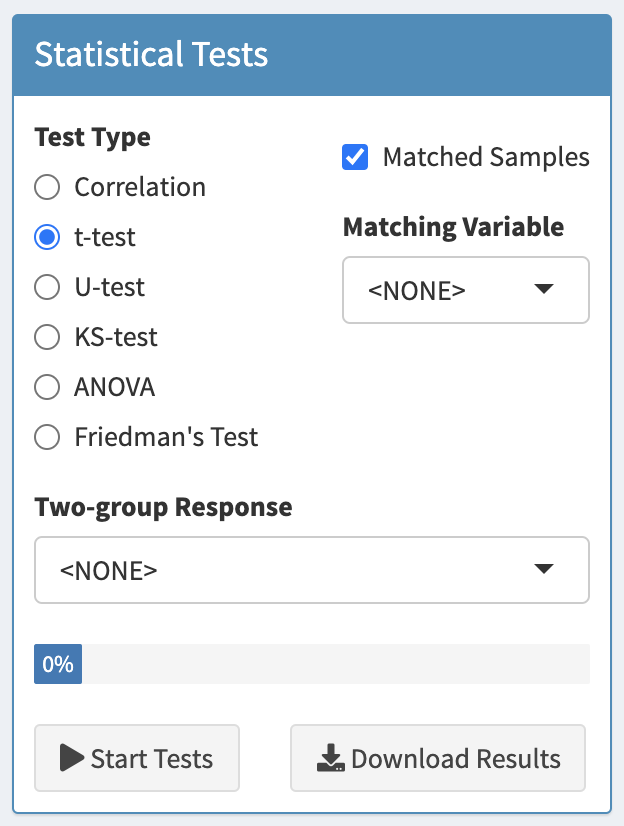
The Settings box in the Statistical Tests panel.
The type of test can be selected from Test Type.
The variable containing the response or the grouping labels can be selected from the select box titled Continuous Response (for Correlation tests), Two-group Response (for t-tests, U-tests, or KS-tests), or Multi-group Response (for ANOVA, Kruskal-Wallis or Friedman’s Test). The label of the select box will change as different test types are selected. Also, the contents of the select box will be updated with variables consistent with the selected test. After selecting a new response variable, tests will be performed for all SOMAmer reagents in the ADAT, which could take a minute or two.
6.3 Paired, matched or repeated measures tests
If a paired t-test, paired U-test, repeated measures ANOVA, or Friedman’s test are required, check the Matched Samples box and select the variable which defines how samples are matched across groups. All matched tests require a complete dataset in which each treatment group consists of the same number of matched subjects, and all subjects have measurements in each group. If your dataset is incomplete and does not have all measurements for all subjects across all groups, ProViz will attempt to adjust the data as necessary. This may, however result in errors. If missing values (NAs) are found in any group labels (Two-group Response or Multi-group Response), or any Matching Variable, the observations with those missing values will be removed and a notice will be displayed.
The following tables illustrate how Grouping and Matching variables should be constructed for the 2-group and multi-group tests, as well as their paired or repeated measures counterparts.
For a two-group test, such as a t-test, U-test, or KS-test, samples must be divided into 2 groups. In Table 6.1, each sample is assigned to either Group_A or Group_B. If each subject is unique - no repeated samples are taken from the same subject - then only the SampleId and Group_Id columns are needed. In the example in Table 6.1, there would be 10 subjects, 5 in Group_A and 5 in Group_B, and the Matching_Id column is not needed.
If, however, samples were taken from each subject twice - for example, a pre-treated and post-treated sample taken from every subject - an additional column is required to indicate which samples came from the same subject. In the example in Table 6.1, there would be only 5 subjects, and a sample was taken from each subject twice. The Matching_Id column indicates which samples came from the same subjects across the 2 groups.
| SampleId | Group_Id | Matching_Id |
|---|---|---|
| Sample_1 | Group_A | Subject_1 |
| Sample_2 | Group_A | Subject_2 |
| Sample_3 | Group_A | Subject_3 |
| Sample_4 | Group_A | Subject_4 |
| Sample_5 | Group_A | Subject_5 |
| Sample_6 | Group_B | Subject_1 |
| Sample_7 | Group_B | Subject_2 |
| Sample_8 | Group_B | Subject_3 |
| Sample_9 | Group_B | Subject_4 |
| Sample_10 | Group_B | Subject_5 |
For a multi-group test, such as ANOVA, Kruskal-Wallis, repeated measures ANOVA and Friedman’s Test, the Grouping and Matching works similarly but with more than two groups.
If each subject is unique - no repeated samples are taken from the same subject - then only the SampleId and Group_Id columns are needed. In the example shown in Table 6.2, there would be 20 subjects, 5 in each group and the Matching_Id column is not needed.
If, however, samples were taken from each subject twice - for example, a time course study with samples taken from each subject at each of 4 timepoints - an additional column is required to indicate which samples came from the same subject. In the example in Table 6.2, there would be only 5 subjects, and a sample was taken from each subject four times. The Matching_Id column indicates which samples came from the same subjects across the 4 groups.
| SampleId | Group_Id | Matching_Id |
|---|---|---|
| Sample_1 | Group_A | Subject_1 |
| Sample_2 | Group_A | Subject_2 |
| Sample_3 | Group_A | Subject_3 |
| Sample_4 | Group_A | Subject_4 |
| Sample_5 | Group_A | Subject_5 |
| Sample_6 | Group_B | Subject_1 |
| Sample_7 | Group_B | Subject_2 |
| Sample_8 | Group_B | Subject_3 |
| Sample_9 | Group_B | Subject_4 |
| Sample_10 | Group_B | Subject_5 |
| Sample_11 | Group_C | Subject_1 |
| Sample_12 | Group_C | Subject_2 |
| Sample_13 | Group_C | Subject_3 |
| Sample_14 | Group_C | Subject_4 |
| Sample_15 | Group_C | Subject_5 |
| Sample_16 | Group_D | Subject_1 |
| Sample_17 | Group_D | Subject_2 |
| Sample_18 | Group_D | Subject_3 |
| Sample_19 | Group_D | Subject_4 |
| Sample_20 | Group_D | Subject_5 |
Once a test has been conducted, the Statistical Results Table will contain all test results and can be downloaded as a comma-separated file (.csv) by clicking the Download Results button.
6.4 Plots
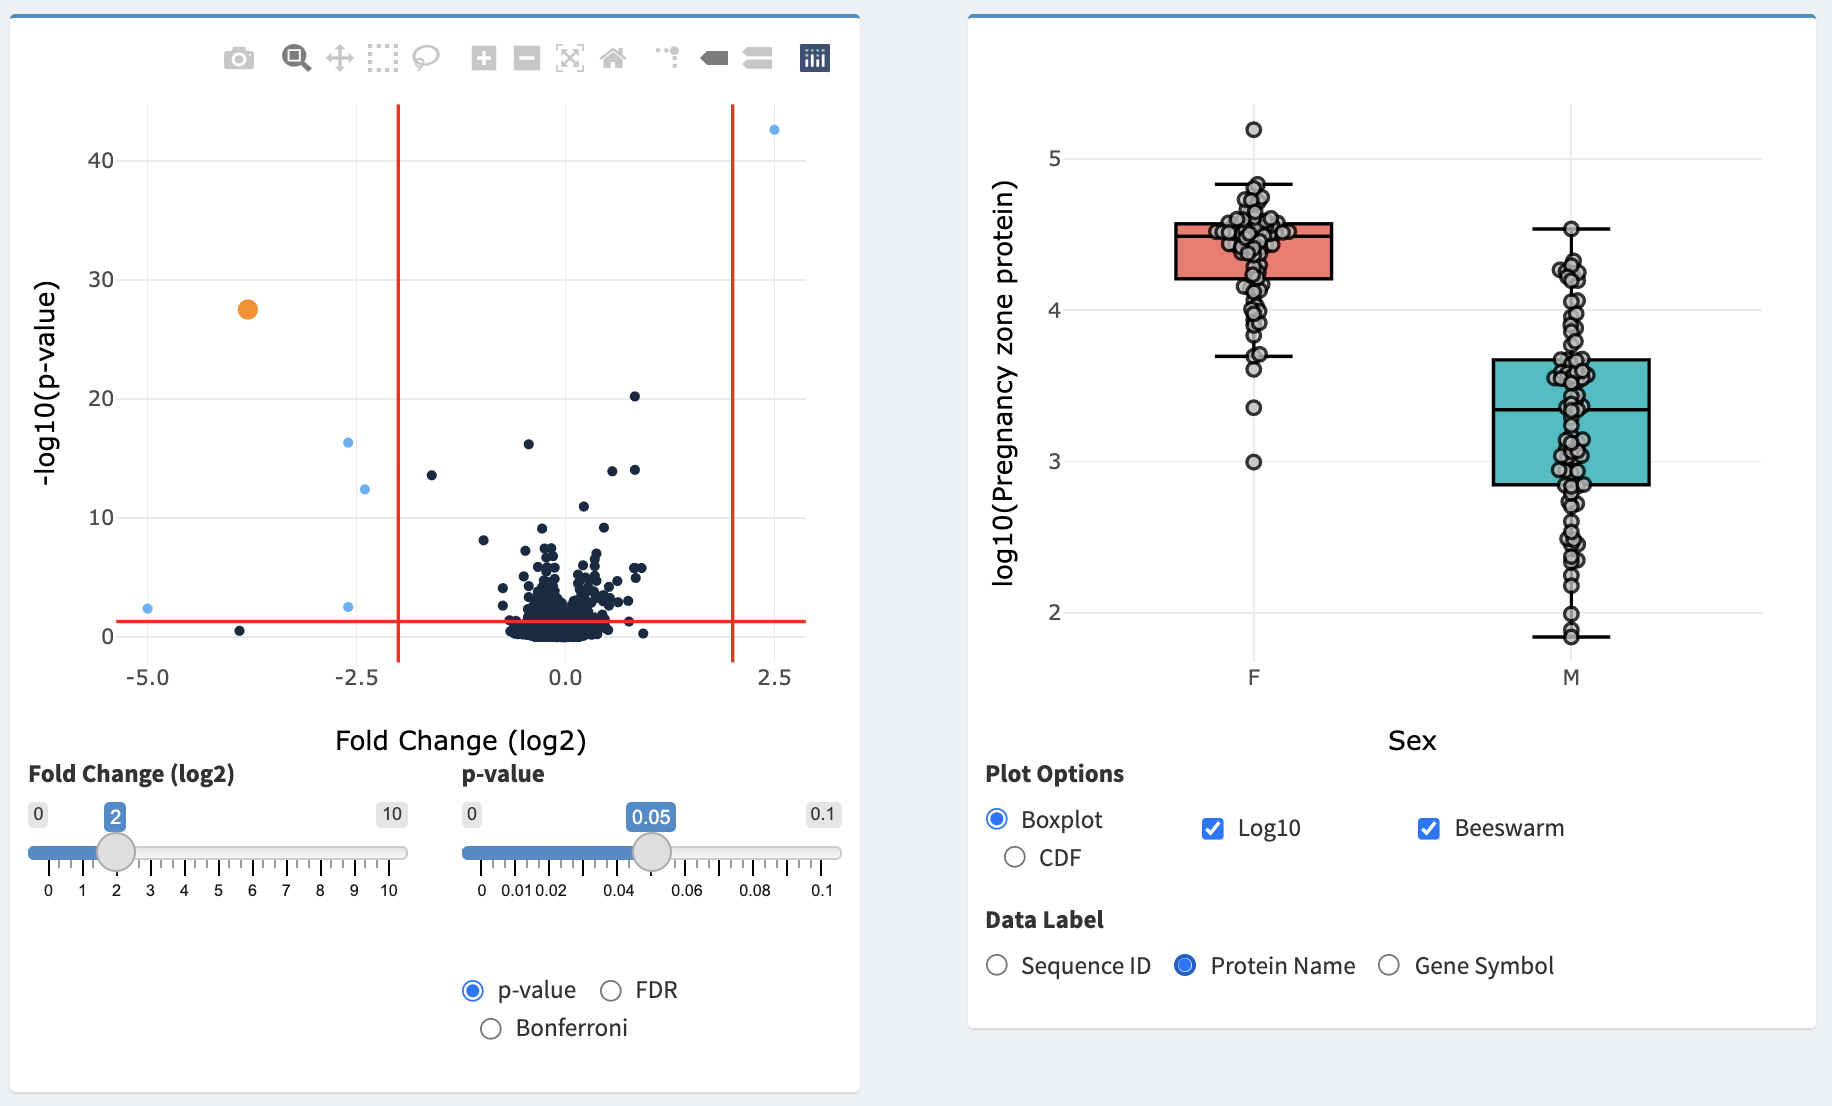
The Volcano Plot and Distribution Plot in the Statistical Tests panel.
After the statistical test is complete and the results table has been loaded, a volcano plot is displayed. For the t-test and U-test, this plot illustrates each SOMAmer-detected protein as a point with the X-axis being the log2(fold change) and the Y-axis being -log10(p-value). For a correlation test, the X-axis will illustrate the Pearson’s Correlation Coefficient. For ANOVA, Kruskal-Wallis, and Friedman’s Test, the X-axis will illustrate the maximum fold-change between medians of all groups. The left slider (Fold Change (log2) for all tests except correlation, and Correlation for the correlation test) and the p-value slider can be used to adjust the vertical and horizontal red lines in the plot, which represent cutoff values for identifying biomarkers of interest. Selecting p-value, FDR, or Bonferroni will determine which type of p-value correction is used for plotting.
Hovering over points on the volcano plot will provide a pop-out detailing information of the SOMAmer reagent associated with that point. Additionally, a table will be displayed below the Statistical Tests box with summary information as well as a plot to the right illustrating the data behind the selected point. For correlation tests, a scatter plot of the SOMAmer-detected protein data versus the response will be displayed. For all other tests, boxplots or CDF plots for that SOMAmer-detected protein are shown - the plot can be changed between boxplot and CDF by selecting under Plot Options. Data can be log10 transformed by selecting Log10 and individual points can be displayed by selecting Beeswarm. Hovering over points on this plot will provide additional information about the specific sample associated with that point, and hovering over the boxplot will provide summary statistics. The Y-axis of the plot can be labeled with the Sequence ID, Protein Name, or Gene Symbol by selecting the appropriate item under Data Label.
For matched tests, matched observations across groups can be connected with lines by selecting the Plot Matched checkbox on the Distribution Plot.
6.5 Statistical Results Table
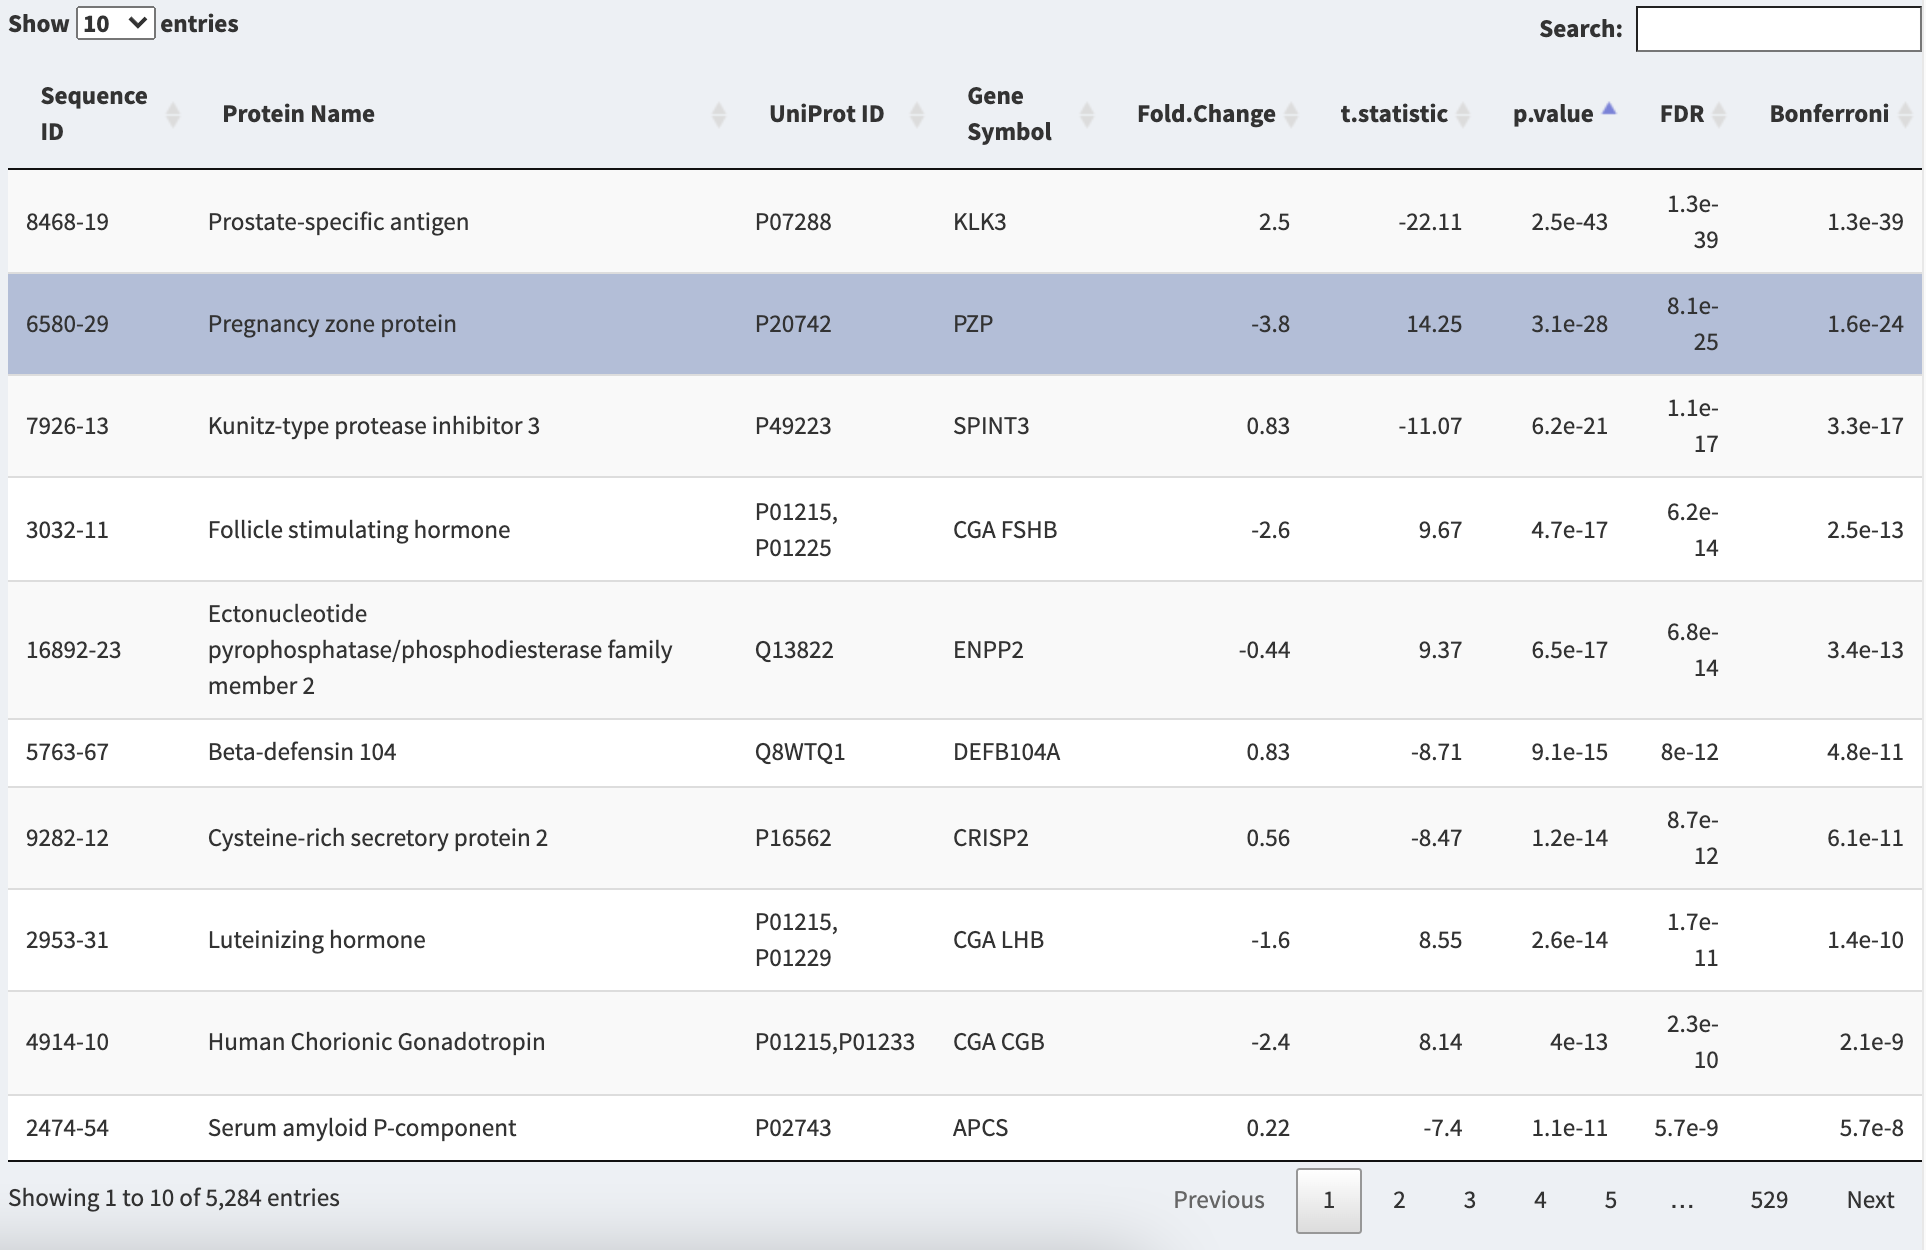
The Statistical Results Table in the Statistical Tests panel.
Results of the statistical test performed for all SOMAmer reagents will be displayed in the Statistical Results Table. All protein identifiers (SOMAmer ID, Protein Name, UniProt ID, Gene Symbol) will be displayed along with Fold Change, Maximum Fold Change, or r (Pearson’s correlation coefficient), depending on the chosen test. Additional columns contain, the test statistic, p-value, and p-values adjusted for multiple testing by False Discovery Rate (FDR) or Bonferroni correction. The table can be sorted by clicking on the double arrow next to any column name, or searched for protein name or gene symbol. Selecting a row in the table will result in that point being illustrated in the volcano plot as well as a distribution or scatter plot.