Lifting and Bridging SomaScan
Stu Field, SomaLogic Operating Co., Inc.
Source:vignettes/articles/lifting-and-bridging.Rmd
lifting-and-bridging.RmdOverview
SomaDataIO contains functionality to bridge (aka “lift”)
between various SomaScan versions by linear transformations of RFU data.
Lifting between various versions is essentially a calibration of the
analytes/features in RFU space.
Why lift?
The SomaScan platform continually improves its technical processes between assay versions. The primary change of interest is content expansion, and other protocol changes may be implemented including: changing reagents, liquid handling equipment, and well volumes.
For any given analyte, these technical upgrades may result in minute measurement signal differences, requiring a calibration (aka “lifting” or “bridging”) to bring RFU values into a comparable signal space. This is accomplished by applying an analyte-specific scalar, a linear transformation, to each analyte RFU measurement (column).
Lifting Requirements
There are 4 main requirements in order to reliably bridge across SomaScan signal space:
- the
soma_adatobject attributes, where SomaScan signal information is stored, must be intact (seeis_intact_attr()). - the sample matrix must be either human serum or human EDTA-plasma. No other matrices are currently supported. Additionally, bridging must not be applied across matrices (i.e. serum plasma).
- the RFU data must have been normalized by Adaptive Normalization via Maximum-Likelihood (ANML). This is the standard normalization for most SomaScan deliveries.
- the current SomaScan version and signal space must be one of those
above (see table), i.e. one of
5k,7k, or11k. Older versions of SomaScan are not supported.
Lifting Scalars
Lifting (aka “bridging”) scalars are numeric values used to multiply a vector of RFU values to linearly transform them into another signal space.
Lifting scalars are generated from matched samples (n 1000) from a healthy, normal reference population were run across assay versions. This experiment was run separately for both serum and plasma and all SomaScan runs were first normalized as per the standard normalization procedure, and flagged samples were removed prior to further analysis.
For each analyte, the lifting scalar is computed as the ratio of
population medians between assay versions. For example, the
linear scalar for the
analyte translating from 11k
7k is defined as:
where
is the median signal for the
analyte. Signals generated in 11k space can be multiplied
by this scale factor to translate into 7k space.
Below is a concordance plot of what this shift would look like for a single analyte on a simulated reference population. Please see the section below on Lin’s CCC for its definition and interpretation.
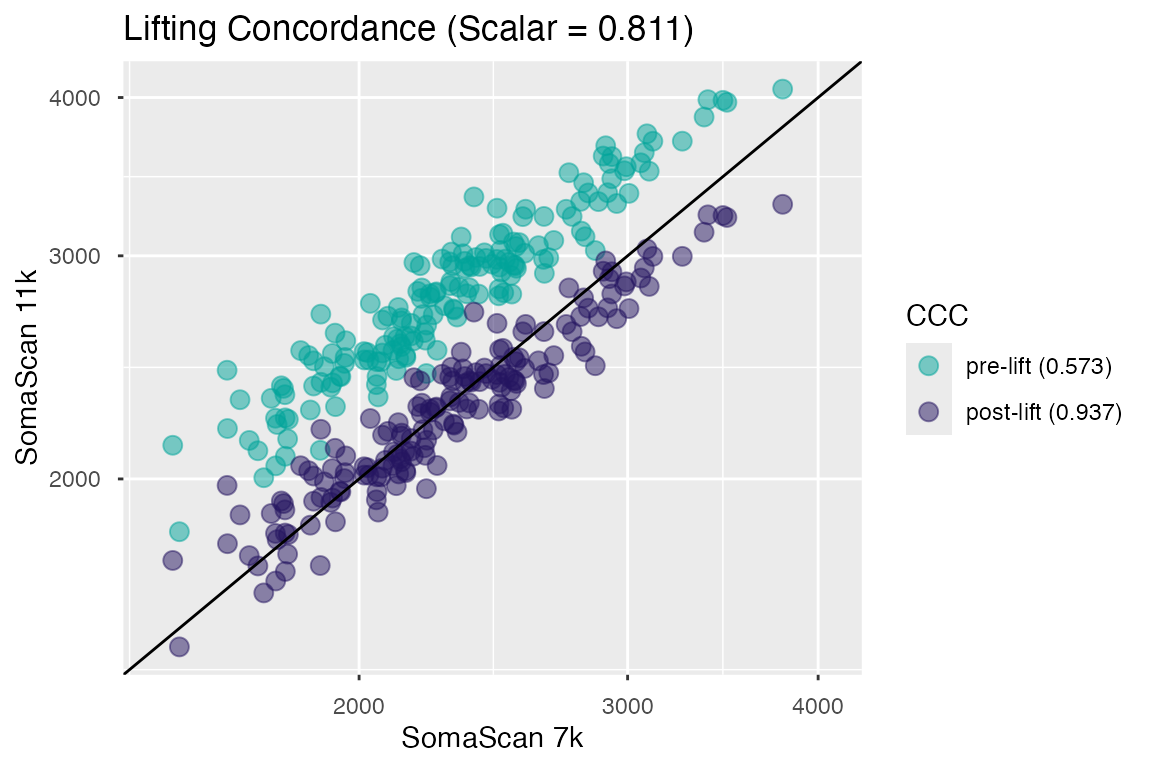
Figure 1. Signal concordance for a single analyte pre- and post-lifting.
Lifting Concordance
Measurements generated from the matched samples used to calculate the lifting scalars were also used to calculate the post-hoc Lin’s Concordance Correlation Coefficient (CCC) estimates of the SomaScan bridge.
Lin’s CCC is calculated by computing the correlation between post-lift RFU values and the RFU values generated on the original SomaScan version, and is defined by:
where , , and are the Pearson correlation coefficient, and the estimated mean and standard deviation from assay version groups x and y respectively.
Interpretation of CCC
Lin’s CCC was chosen to evaluate lifting performance because it is characterized not only by correlation (Pearson’s ), but also accounts for deviation from the unit line (diagonal). CCC range is in and can be viewed as an estimate of the confidence in the bridging transformation (in normal reference samples) across SomaScan versions. Examples of factors that could affect lifting CCC are:
- analytes/reagents with high intra-assay CV (Coefficient of Variation)
- analytes/reagents signaling near background or saturation levels
Accessing CCC
The getSomaScanLiftCCC() function retrieves these values
from an internal object for either "serum" and
"plasma".
plasma <- getSomaScanLiftCCC("p")
plasma
#> # A tibble: 11,083 × 4
#>    SeqId  plasma_11k_to_5k_ccc plasma_11k_to_7k_ccc plasma_7k_to_5k_ccc
#>    <chr>                 <dbl>                <dbl>               <dbl>
#>  1 10000…                0.966                0.982               0.963
#>  2 10001…                0.86                 0.961               0.875
#>  3 10003…                0.674                0.787               0.668
#>  4 10006…                0.864                0.927               0.877
#>  5 10008…                0.879                0.939               0.908
#>  6 10010…               NA                    0.915              NA
#>  7 10011…                0.642                0.784               0.743
#>  8 10012…                0.528                0.661               0.591
#>  9 10013…                0.76                 0.824               0.744
#> 10 10014…                0.934                0.971               0.941
#> # ℹ 11,073 more rows

serum <- getSomaScanLiftCCC("s")
serum
#> # A tibble: 11,083 × 4
#>    SeqId    serum_11k_to_5k_ccc serum_11k_to_7k_ccc serum_7k_to_5k_ccc
#>    <chr>                  <dbl>               <dbl>              <dbl>
#>  1 10000-28               0.97                0.977              0.967
#>  2 10001-7                0.819               0.857              0.875
#>  3 10003-15               0.761               0.759              0.774
#>  4 10006-25               0.903               0.937              0.937
#>  5 10008-43               0.915               0.951              0.925
#>  6 10010-10              NA                   0.895             NA
#>  7 10011-65               0.515               0.748              0.741
#>  8 10012-5                0.57                0.717              0.716
#>  9 10013-34               0.716               0.86               0.778
#> 10 10014-31               0.906               0.951              0.913
#> # ℹ 11,073 more rows
cdf_df <- data.frame(
  ccc    = c(plasma$plasma_11k_to_7k_ccc, serum$serum_11k_to_7k_ccc),
  matrix = rep(c("plasma", "serum"), each = nrow(plasma))
)
cdf_df <- cdf_df[!is.na(cdf_df$ccc), ]   # rm NAs; non-comparable analytes
ggplot(cdf_df, aes(x = ccc, colour = matrix)) +
  stat_ecdf(linewidth = 0.75) +
  scale_colour_manual(name = "", values = c("#00A499", "#24135F")) +
  labs(title = "CDF of CCC Values",
       x = "Lin's CCC (11k -> 7k)", y = "P(X < x)") +
  coord_cartesian()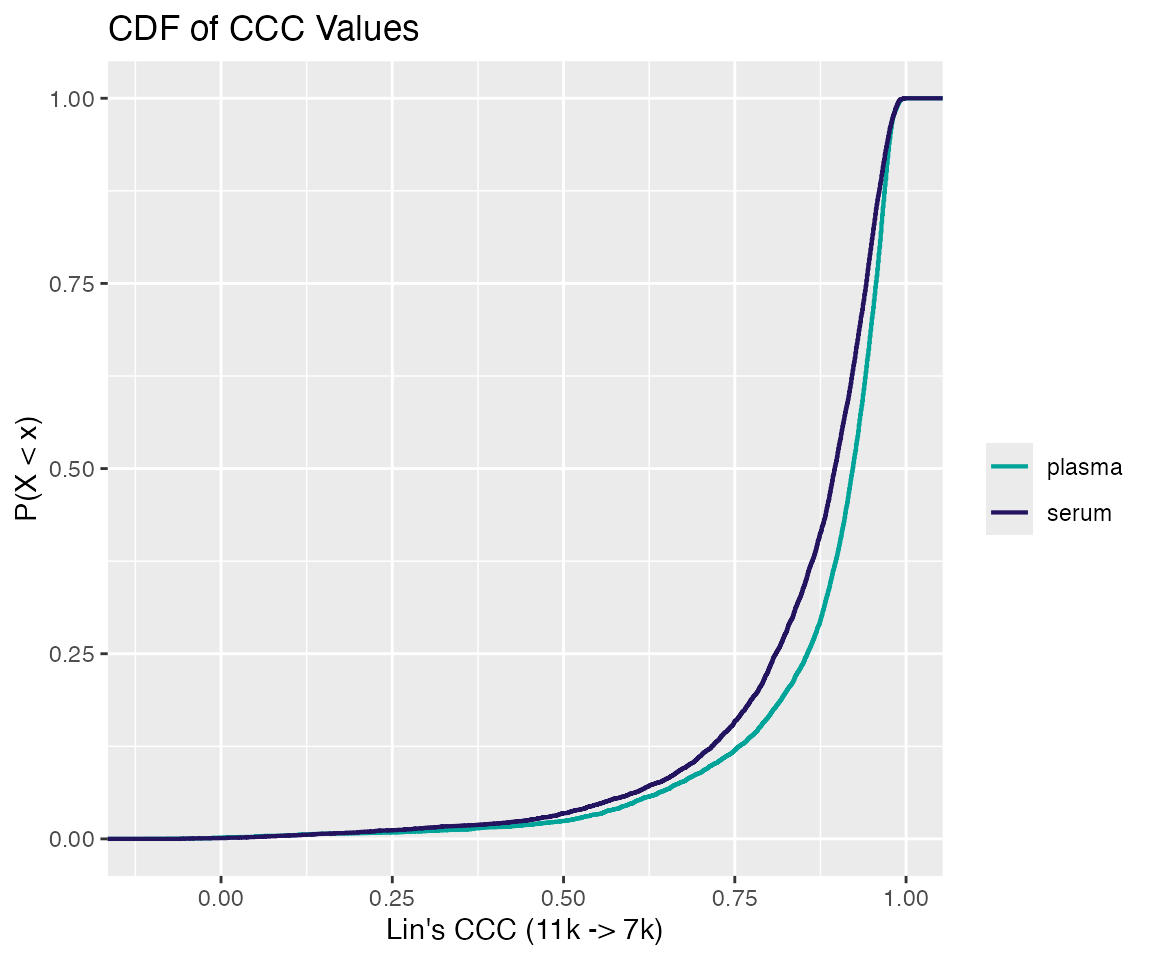
Figure 2. Cumulative distribution function of CCC values for the 11k -> 7k lift.
As shown in distribution above, for the 11k
7k lift, post-bridging CCC values above 0.75 (considered
high quality) are approximately 88% and 84% of the SomaScan menu for
plasma and serum respectively. In fact, characterizing CCC lifting
quality into 3 categories (Low, Medium, High) yields the table
below:
| Matrix | Low [0, 0.5) | Medium [0.5, 0.75) | High [0.75, 1] |
|---|---|---|---|
| Plasma | 0.024 | 0.096 | 0.880 |
| Serum | 0.035 | 0.124 | 0.841 |
SomaScan Analyte Setdiff
For any given bridge, there is a common, intersecting subset of
analytes between SomaScan versions. Non-intersecting analytes will be
either missing or added in the new signal space. As a result, bridging
data across SomaScan may involve either skipping analytes (columns) or
scaling by 1.0. SomaDataIO has internal checks that trigger
warnings if these conditions are met.
There are two scenarios to consider:
- Newer versions of SomaScan typically have additional content,
i.e. new reagents added to the multi-plex assay that bind to additional
proteins. When lifting to a previous SomaScan version, new
reagents that do not exist in the “earlier” assay version assay
are scaled by 1.0, and thus are maintained, unmodified in the returned
object. Downstream analysis may require removing these columns in order
to combine these data with a previous study from an earlier SomaScan
version, e.g. with
collapseAdats(). - In the inverse scenario, lifting “forward” from a previous,
lower-plex version, there will be extra reference values that are
unnecessary to perform the lift, and a warning is triggered. The
resulting data consists of RFU data in the “new” signal space, but with
fewer analytes than would otherwise be expected (e.g.
11kspace with only 5284 analytes; see example below).
Example: 5k
11k
Since example_data object was originally run on SomaScan
V4, this vignette will demonstrate the lifting/bridging process
from a 5k
11k signal space, the most recent SomaScan version.
Steps
-
Determine that attributes are intact.
is_intact_attr(adat) -
Determine the matrix type of the data (serum or plasma).
attr(adat, "Header.Meta")$HEADER$StudyMatrix -
Ensure the current SomaScan signal space is lift-supported.
getSignalSpace(adat) checkSomaScanVersion(getSignalSpace(adat)) -
Apply analyte-specific scalars to their corresponding columns via
lift_adat().lift_adat(adat, bridge = "<direction>")Current
bridgeoptions are: “11k_to_7k”, “11k_to_5k”, “7k_to_11k”, “7k_to_5k”, “5k_to_11k”, “5k_to_7k”.
Step 1
# determine intact attributes
# must be TRUE
is_intact_attr(example_data)
#> [1] TRUE
Step 2
# determine study matrix
# must be Human Serum or EDTA-Plasma
attr(example_data, "Header.Meta")$HEADER$StudyMatrix |> as.character()
#> [1] "EDTA Plasma"
Confirm that the matrix of the SomaScan run was
"EDTA Plasma":
Step 3
# determine if current space can be lifted
# must be V4, v4.1, or v5.0
from_space <- getSignalSpace(example_data)
from_space
#> [1] "V4"

# must be NULL
is.null(checkSomaScanVersion(from_space))
#> [1] TRUE
Finally, invoke lift_adat() to perform the
bridge/transformation:
Step 4
lift_11k <- lift_adat(example_data, bridge = "5k_to_11k")
#> Warning: There are extra scaling values (5799) in the reference.
#> They will be ignored.

is_lifted(lift_11k)           # signal space was lifted
#> [1] TRUE

is.soma_adat(lift_11k)        # preserves 'soma_adat' class
#> [1] TRUE

getSignalSpace(lift_11k)      # current space
#> [1] "v5.0"

getSomaScanVersion(lift_11k)  # original space
#> [1] "V4"
Caveats to Consider
Was the SomaScan bridge successful?
Lifting SomaScan involves a simple linear transformation of a numeric vector (of RFU values), thus in one sense it will always be “successful”. However, users often wish to know if this was the correct course of action for their data.
From the concordance plot in Figure 1, we can see
that the transformation is reducing the 11k RFU
brightness by ~19% in accordance with the median signal difference that
existed in the reference population (of healthy normals). Rare edge
cases aside, this is usually the desired outcome, otherwise
downstream analysis would be confounded by the uncorrected shift in
SomaScan space, and would likely result in significant differences
related to signal space rather than actual biology.
Should you filter analytes?
Users often ask if certain analytes be should removed based on a given CCC threshold prior to analysis. The issue of choosing an appropriate threshold aside, unless there is prior knowledge justifying removal, we do not recommend removing analytes based on CCC alone.
This advice stems from how the CCC values are initially calculated; i.e. from a healthy, normal reference population sampled across two versions of SomaScan. Recall that CCC is influenced by CV and thus signaling range. For example, if a given analyte is near its limit of detection in a healthy population, and therefore likely has a high(er) CV, i.e. low CCC, removing this analyte may not be the desired course of action in a disease population where that analyte could be signaling in the linear range.
Therefore, we currently recommend careful evaluation on a case by case basis using prior knowledge and orthogonal justification before filtering analytes from discovery or exploratory analyses.
Questions
As always, if you have any bridging or lifting questions, we are here to help. Please reach out to us via:
- via GitHub SUPPORT
- Global Scientific Engagement Team: techsupport@somalogic.com
- General SomaScan inquiries: support@somalogic.com